Fleet Overview & Central Control
The Fleet Overview console is the central nervous system of CollectorCtrl. It provides real-time visibility, live health metrics, configuration analysis, and process control for every connected OpenTelemetry Collector across your global infrastructure.
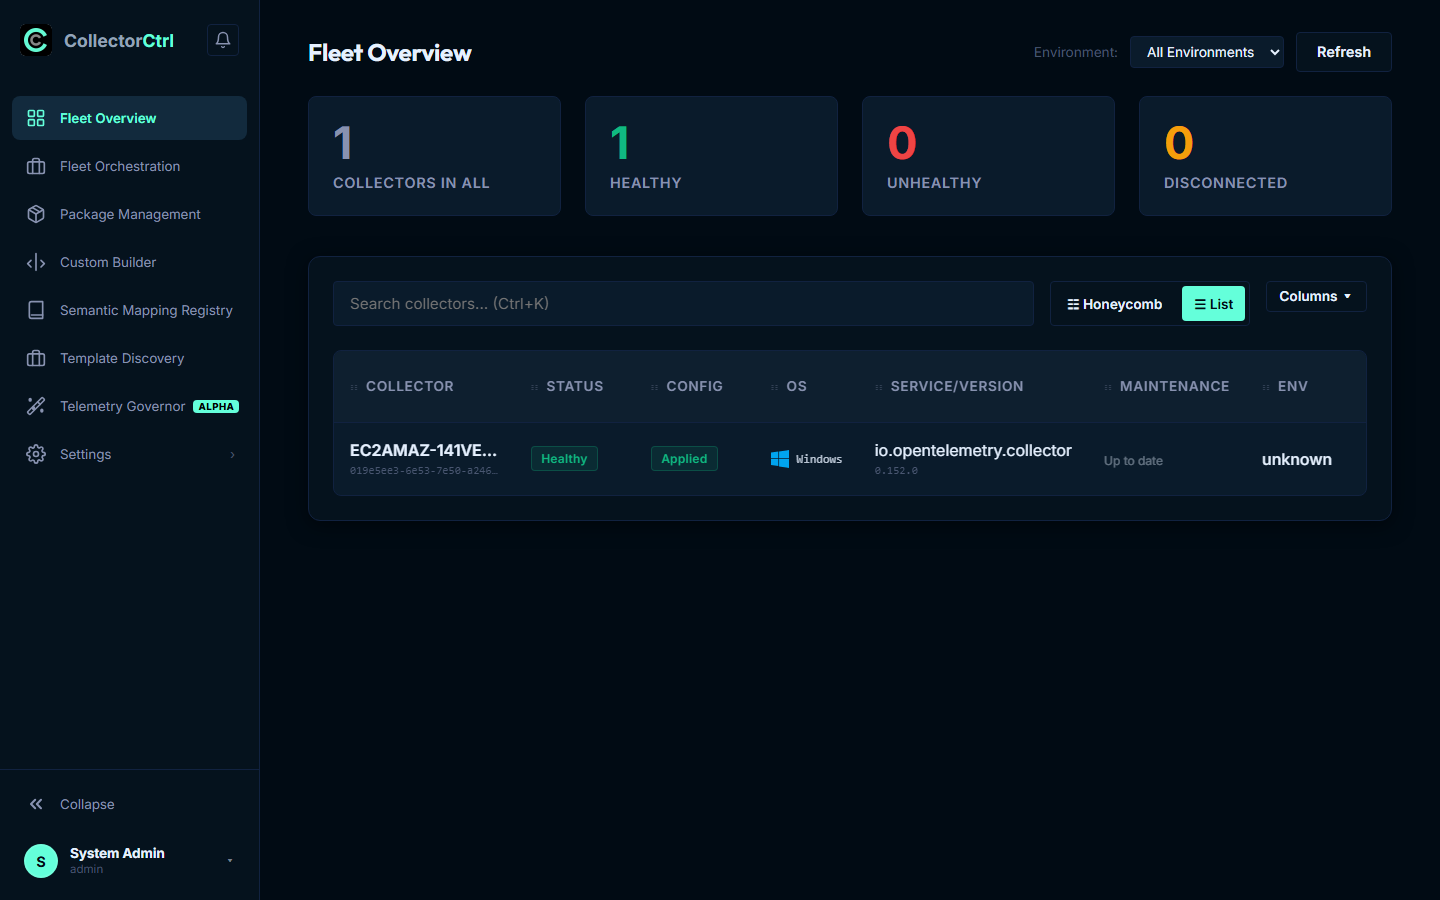
1. The Fleet Inventory Dashboard
The dashboard provides a real-time list of all active and historical agents. Each agent node reports its telemetry profile through OpAMP, allowing CollectorCtrl to dynamically resolve and render key host and pipeline details.
Metadata Resolution Priority
To keep your fleet organized without manual tagging, the inventory screen resolves agent names and environments automatically:
- Display Name Resolution: Resolved using the priority order:
host.name(system hostname)otel.collector.display_name(custom user attribute)Instance ID(cryptographic agent UUID fallback)
- OS & Runtime Detection: Checks the agent's reported OS indicators (
os.type,host.os, oros.description). The UI renders dedicated system badges for Windows, Linux, macOS, and container environments. - Environment Mapping: Evaluates user-defined rules to assign the agent to environments (e.g.
production,staging,development).
2. Configuration Management: Effective vs. Override
One of CollectorCtrl's most powerful capabilities is compiling complex YAML configurations on-the-fly. This system divides configuration into two distinct layers:
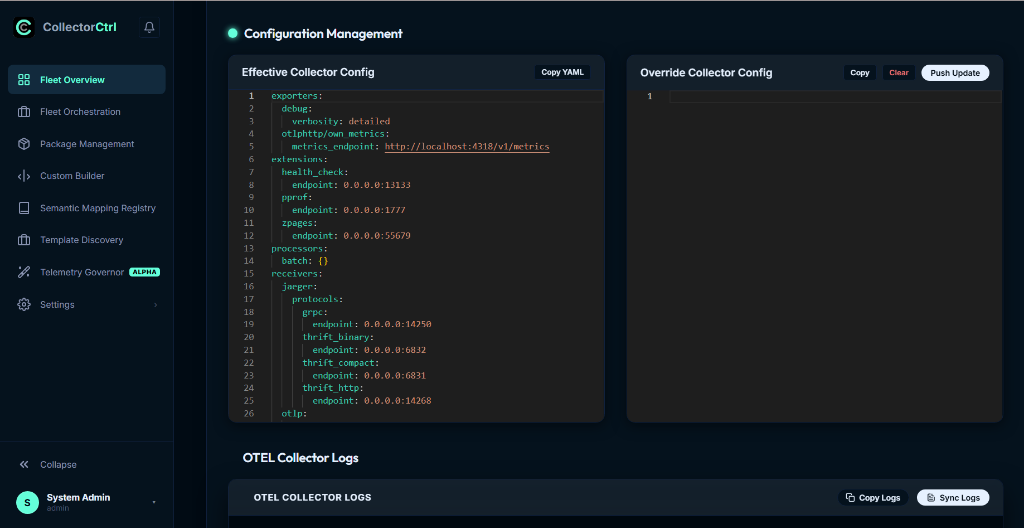
Effective Config
The Effective Config is the absolute final, ready-to-run YAML configuration compiled by the control plane. It is the result of merging:
- The global policy template matching the agent's labels.
- Any environment-specific baseline parameters.
- Node-specific Override Configs.
The Effective Config is verified for syntactic correctness before the server transmits it to the Supervisor via the OpAMP channel.
Override Config
The Override Config allows administrators to define node-specific variations. This is crucial for local parameters that shouldn't be hardcoded in global policies.
During compilation, CollectorCtrl performs a deep YAML merge, overlaying the Override parameters directly on top of the parent templates to generate the final Effective Config.
How Override Merging Works
When writing an override, you only need to specify the specific keys you want to change or add. You do not need to repeat the rest of the parent template.
For example, if the parent policy template defines an OTLP receiver:
receivers:
  otlp:
    protocols:
      grpc:
        endpoint: 0.0.0.0:4317
      http:
        endpoint: 0.0.0.0:4318
To configure a specific node to listen on port 5317 for gRPC instead, define this in the Override Config:
receivers:
  otlp:
    protocols:
      grpc:
        endpoint: 0.0.0.0:5317
CollectorCtrl will merge this overlay, producing an Effective Config where only the target gRPC endpoint is updated.
Override Examples
Here are common examples of override configuration snippets:
-
Overriding an Exporter Endpoint & TLS Certs:
exporters: otlp: endpoint: https://ingest.regional.internal:443 tls: ca_file: /etc/collectorctrl/certs/regional-ca.pem -
Modifying Log Verbosity for Debugging:
exporters: debug: verbosity: detailed -
Injecting Node-Specific Resource Attributes:
processors:
  resourcedetection:
    detectors: [env]
    timeout: 3s
⚠ Do's & Don'ts for Override Configurations
| Do's | Don'ts |
|---|---|
| Keep it minimal: Only specify the exact keys that differ from the parent template. | Don't copy-paste the entire template: Avoid duplications that make upgrading central templates harder. |
Match keys exactly: Verify that component names (e.g. otlp, batch) match the parent configuration exactly. | Don't redefine service pipelines: Redefining service.pipelines in the override will completely replace the parent pipelines array, which can break telemetry routing. |
Use Environment Variables: Reference local variables (e.g. ${env:DB_PASSWORD}) for sensitive credentials instead of typing them in cleartext. | Don't change value types: Avoid changing value structures (e.g. replacing a single string with an array) as it will fail compilation. |
| Verify indentation: Ensure that your override YAML aligns with the structural hierarchy of the parent template. | Don't duplicate component names: Do not define a component under a different name if you intend to override an existing one. |
💡 YAML List Merging Gotchas (Array Replacement)
A key detail to remember when writing overrides is how YAML lists (arrays) behave during a deep merge versus maps (objects):
- Maps (Key-Value Objects): Merged key-by-key. If a key is omitted in the override, the parent value is preserved.
- Lists/Arrays (Sequences/Lists): Replaced in their entirety. If you specify a list in the override, it completely overwrites the parent list rather than appending to it.
Example: Redefining Receivers
Suppose the parent template defines the following metric pipeline:
service:
  pipelines:
    metrics:
      receivers: [otlp, prometheus, hostmetrics]
      processors: [batch]
      exporters: [otlp]
If you want a node to receive telemetry from an additional receiver (e.g. kubeletstats), do not write:
# ❌ INCORRECT OVERRIDE: Wipes out parent receivers!
service:
  pipelines:
    metrics:
      receivers: [kubeletstats]
Because receivers is a list, this override will replace the parent list completely, disabling the otlp, prometheus, and hostmetrics receivers on this host.
To correctly add a receiver, you must re-specify the entire list of active items in your override:
#  CORRECT OVERRIDE: Preserves parents and adds the new receiver
service:
  pipelines:
    metrics:
      receivers: [otlp, prometheus, hostmetrics, kubeletstats]
3. OTel Collector Logs & Sidecar Logs
Under the collector details view, you can access real-time logging streams from the target process. This section has been updated to use clear OpenTelemetry-native naming conventions:
OTel Collector Logs
(Formerly known as the Telemetry Observations Application Log Stream)
Exposes the raw, real-time stdout and stderr output stream of the primary OTel Collector binary managed by the Supervisor. This is invaluable for detecting:
- Broken network connections to remote backends (e.g. HTTP 503 or TLS handshake errors)
- Malformed pipeline structures (e.g. invalid processor configuration warnings)
- Drop-rate and rate-limiting metrics reported by exporter queues
Sidecar Collector Log
Exposes the logs of any containerized or secondary collector process managed by the Supervisor on the same node. This is particularly useful in Hybrid Sidecar deployments where a secondary OTel distribution is running next to the vendor's primary agent to handle missing exporters or custom processing scripts.
4. Remote Process Control & Collector Actions
From the actions panel in the UI, administrators with the fleet.control permission can trigger immediate execution commands. The server translates these commands into secure OpAMP packets that the Supervisor executes locally:
- Start Collector: Commands the Supervisor to spawn the OTel Collector child process if it is stopped.
- Stop Collector: Gracefully shuts down the OTel Collector process while keeping the Supervisor connected.
- Restart Collector: Performs a fast process stop and restart to force the collector to bind to new ports or re-initialize connections.
- Restart Supervisor: Restarts the parent Supervisor Windows Service or systemd daemon to reload system-level parameters.
- Fetch Logs: Requests a 100-line sample of the latest OTel Collector logs and Supervisor status audits, displayed directly in the web terminal overlay.